4
Determinants of EU integration
Determinants of EU integration
Determinants of EU integration
The challenges facing the EU, as described in Chapter 3, will require political leaders and the European citizenry to follow through on the commitment made in the Solemn Declaration of European Union to produce “an ever closer union among the peoples and Member States.”1 On the economic front, a deepening of integration will enhance the advantages of the EU’s internal market (yet to be completed) and protect its members against external and domestic shocks by creating symmetry across the regions. Politically, a deeper union will legitimize governance of a more united EU and bring its institutions closer to the people. Such deepening of political integration will also provide protection against nationalistic outlooks that favor a dissolution of the Union which became a potential reality with Britain voting to leave the EU. At the same time, political union will go a long way in legitimizing the EU as a true global actor.
One could argue that perhaps creating the Economic and Monetary Union prior to completion of the Common Market (Single Market) was premature, but external systemic challenges pushed European leaders to make that decision. Subsequent monetary union among some of the states further created division within the Union and created a two-track Europe. When we add to this the very slow pace of political union, the future of regional integration looks quite shaky. As some economists would say, “monetary union without a political union would not work.”2 It only takes one major financial crisis to bring that monetary union down like a house of cards. The EU is currently working hard to ensure that will not happen by pushing ahead with new formulas for fiscal coordination that blend its supranational and intergovernmental decision-making mechanisms. Yet, ordinary citizens rarely possess ample information on the EU, its institutions, or its policies. In other words, while the EU knows a lot about its citizens through extensive surveys, the same cannot be said the other way around.
In light of these challenges, this chapter analyzes the determinants of European integration, from 1980 to the present, to determine which factors are important at which stage of integration. We also extend our analysis timeline to 2021 in an effort to determine what factors are needed, and to what degree, for the EU to achieve further integration and perhaps full political union. We will use the modified power transition theory developed in Chapter 2. The theory predicts that integration will develop when there is power asymmetry among regional partners that are also satisfied with the status quo. We modified the theory by specifying the heart of the satisfaction variable, namely value convergence, and introducing trust as an important factor. The remainder of this chapter will describe the variable operationalization and test the hypotheses. Afterwards, we will use our model outcomes to determine what degree of power asymmetry, value convergence, and trust is needed for further integration.
Modeling
For our dependent variable, regional integration, we use the Integration Achievement Score (IAS).3 IAS provides a measure of deepening of integration in the EU and the data of 2016 are taken as constant until 2021. Given Brexit, we also assume for estimation purposes that the UK will leave the EU in 2019. The IAS codes the level of integration in a given year using six categories of institutionalized cooperation among two or more countries using information found in the implemented treaties. Coding is sensitive to the fact that obligations often take time to implement. Therefore, coders conduct a yearly monitoring of actual implementation. The categories are liberalization of trade in goods and services, degree of capital mobility, degree of labor mobility, level of supranational institution importance, degree of monetary policy coordination, and degree of fiscal policy coordination. Each category has a value of 0 (low) through 5 (high) and is coded using a Guttman scale (see Appendix A for explanation of variable measurement). When we look at the level of integration in the EU, it is clear that this is a two-track process. Those members that are in the Eurozone are more integrated than others that are only in the economic union.
For the operationalization of the independent variables, we use hierarchy, values convergence, and trust in the EU. As discussed in Chapter 2, for power transition theory, hierarchy, which is based on the relative power of each state, is an important variable for system stability and promoting cooperation and integration. To approximate the degree of hierarchy within the EU, we construct the following simple measure that scores the relative impact of the dominant nation (Germany) on the largest members of the integrated EU community:
(4.1)
As Figure 4.1 indicates, Germany has been the dominant nation but its status has been on a steady decline over time as other members of the EU have increased their relative power. However, one of the bigger factors in the decline of German power asymmetry is the expansion of membership. The grand eastern enlargement in 2004 added eight new continental members of various sizes and two small Mediterranean islands. With Brexit, we project a slight increase in Germany’s dominance in the hierarchy once again. The EU demonstrates that power preponderance is useful but not a precondition for stability – it is merely one condition for peace. Satisfied nations whose values are converging can maintain a lasting and profitable peace.
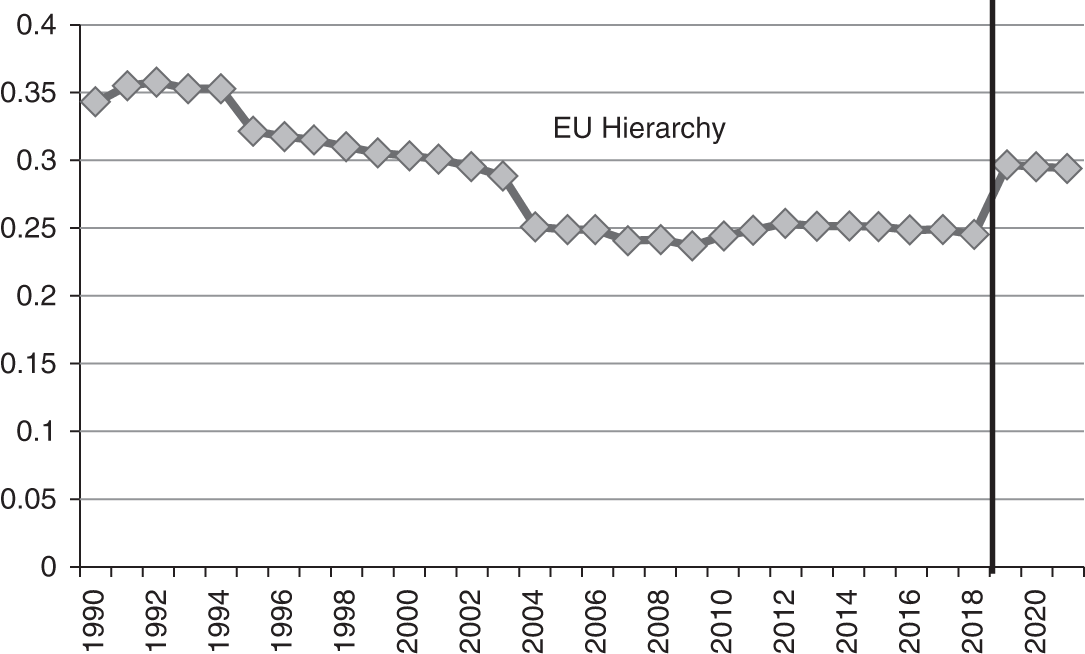 Figure 4.1:
EU Hierarchy with German Leadership.
Figure 4.1:
EU Hierarchy with German Leadership.
The second independent variable for integration is the convergence of social values. As previously explained (see Chapter 2), we use this variable as an indicator of satisfaction with the status quo. Given the role of Germany in the EU hierarchy, we measure convergence towards its values. As the largest economy, Germany has the ability to use its economic influence to direct the process and progress of integration. However, this capacity will be limited by how far its values are from those of the other member states. Therefore, we measure value convergence by calculating the distance of Germany’s values from those of other EU member states based on I-W values indices. Recall that the I-W indices capture two value dimensions: materialist–postmaterialist values on one axis and traditional–secular on the other (see Chapter 2). All survey data used for calculating value convergence come from various years of World Values Surveys (WVSs). For 2017, we use estimates as the seventh wave of the WVS has not been completed. To do this, we used moving averages for previous survey years to project values for materialist–postmaterialist and traditional–secular values for each EU member state in 2017. We then took 2017–2021 as constant to estimate the values data to match estimates for hierarchy and trust in the EU.
The value convergence variable is calculated by using a Euclidean distance formula and measures the distance of materialist-post-materialist and traditional–secular values between two countries:
(4.2)
where; X represents the country’s value on the traditional–secular axis and Y represents the country’s value on the materialist–post-materialist axis.
The statistical model that is utilized in the analyses focuses on value convergence towards Germany. This variable centers on the value distances of all the EU countries towards Germany. The value convergence variable is abbreviated as “VcGer” in the formula(s) and is calculated using a modified version of
(4.3)
Values generated by
Value convergence with the regional leader and a select sample of member states is depicted in Figure 4.2 using pre-transformed values: the larger the number, the less observed value convergence. According to this figure, among the major EU countries, France is the closest country to the leader in terms of values. After France, Spain and Italy have near values with Germany. Compared with these three, the UK and Poland fall farther away from the leader. Over time, we are witnessing greater convergence among the larger EU member states.
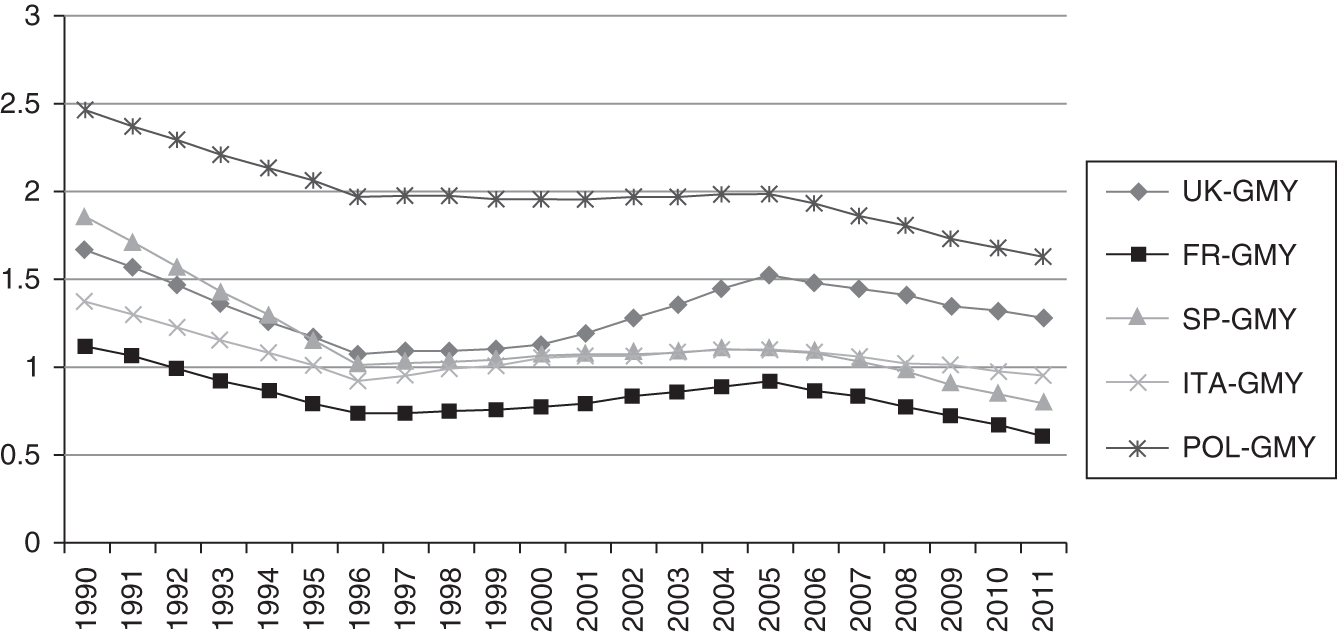 Figure 4.2:
Values Convergence with the Regional Leader (Germany).
Figure 4.2:
Values Convergence with the Regional Leader (Germany).
The third independent is the amount of trust citizens of member states have towards the European Union. Like value convergence, this variable also helps us gauge the amount of member state satisfaction with status quo. Data come from various years of the Eurobarometer surveys. The Eurobarometer survey responses are a rich source of information regarding EU citizen views on European integration because of the frequency of repeated questions. By aggregating the respondents’ answers to the national level, we are able to follow trends in our timeframe.
Unfortunately, the survey series does not ask the ideal question, “How much trust do you have in the EU?” for the entire time series of our analysis. As a result, we selected questions that can best approximate this question and capture the latent value of trust in the EU. There are questions regarding trust in various EU institutions. We believe that the institution that is at the epicenter of European integration in the minds of citizens is the European Commission. It not only drives the enforcement of EU laws and regulations – thereby being the face of Europe – it also introduces the legislation for European Council and Parliament deliberations. The question that asks how much the respondent trusts the European Commission fills in the 2002–2016 data points.
The earlier data points (1973–2001) used another question, which we believe also approximates trust in the EU. The survey series asks the respondent if membership in the EU (or the European Community if it is an early survey) is a good thing, a bad thing, or neither good nor bad. This question has been used in various analyses that attempt to explain general support for European integration.4 Public support for integration is highly correlated with trust because support for integration is generally perceived when trust is present.5
The only annual data points that are missing are country values for 1998. For this year, we linearly interpolate these values. For the countries that are extrapolated, these two measures correlate at 67 percent for the overlapping period. Adjusting commitment to the status quo by levels of trust to anticipate the degree of support for integration is a path we wish to follow to clarify intra-EU relations.
For the operationalization of trust variable in our model, we calculate the variable, Trust towards the European Commission (TrustEC), by a trend function which utilizes the least squares method to calculate the line of best fit for a supplied set of y- and x- values. We further estimated TrustEC for 2017–2021 assuming high trust, a normal moving average, and low trust. Figures 4.3a–c display the trend of TrustEC using survey data points and extrapolation into the future using our normal, low trust, and high trust assumptions. The first figure (4.3a) plots the values for the French respondents only. The overall trend in negative. The optimistic scenario assumes an increase of 5 percent annually and the pessimistic scenario assumes a 5 percent decline per year. The scenarios produce expected up-ticks in the optimistic scenario, flat-lining in the extrapolated moving average (or normal) scenario, and further dipping in the pessimistic scenario. The pessimistic is particularly alarming given that we estimate that approximately only a quarter of the French population will have trust in 2021.
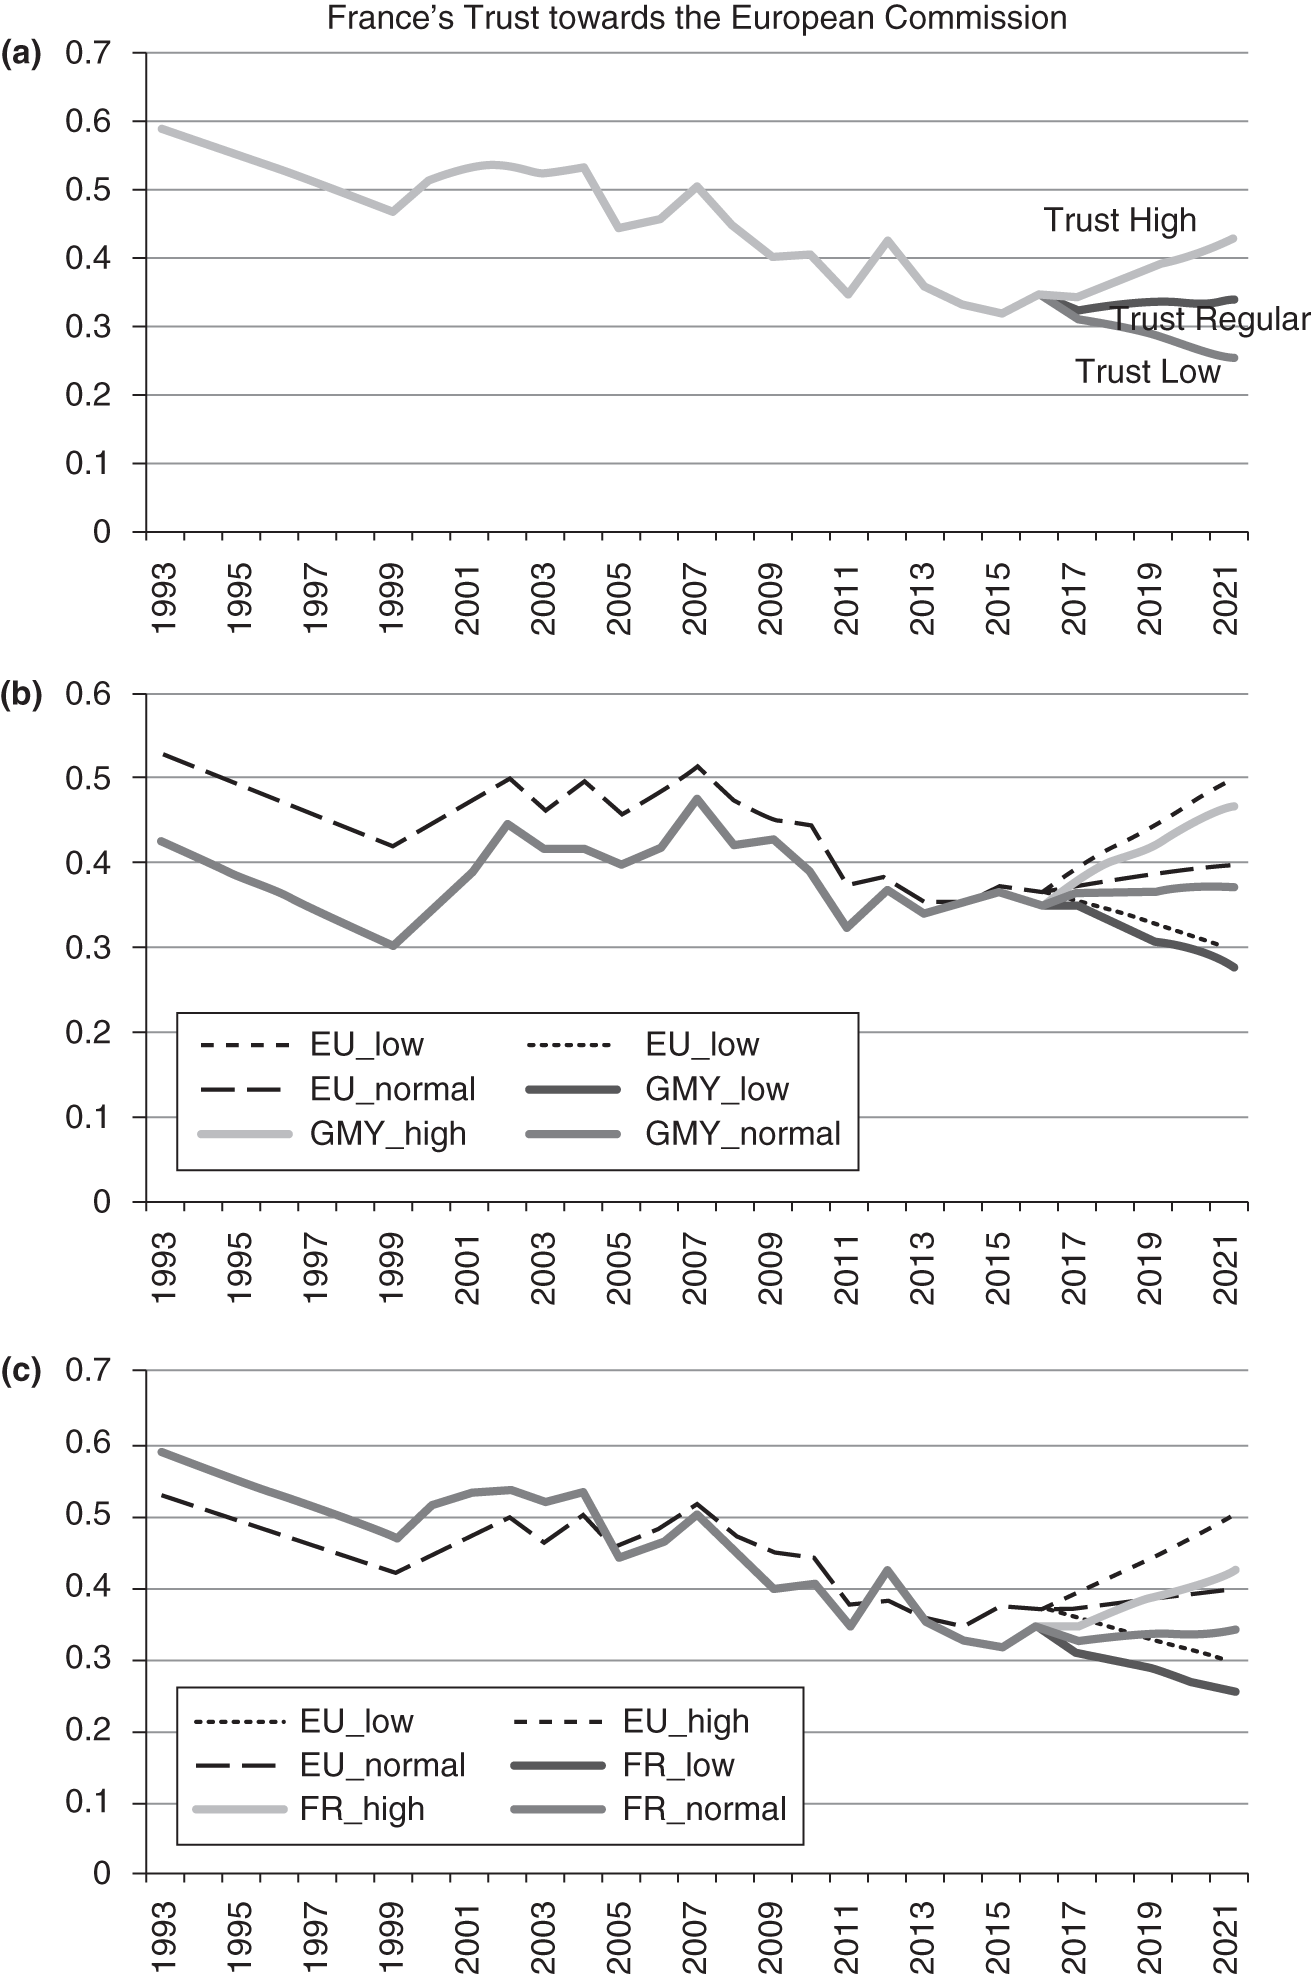 Figure 4.3:
(a) Trust in the European Commission (French Respondents). (b) German and EU Average Trust in the European Commission. (c) French and EU Average Trust in the European Commission
Figure 4.3:
(a) Trust in the European Commission (French Respondents). (b) German and EU Average Trust in the European Commission. (c) French and EU Average Trust in the European Commission
Figure 4.3b displays the data for Germany, as well as the EU average. The two trend together, while German values are lower and then converge over the past four or so years. The overall trend shows steady values, relatively speaking, in the first half the graph followed by a negative trend in the second half. Our worst-case scenario show a decline to about a third of the EU population voicing trust by 2021. The best case has about half the population having trust, with the moving average inching a bit higher to about 40 percent.
Figure 4.3c repeats the values of 4.3a and also includes the EU averages. In the first half of the graph, the French were trending higher than the average but then converge in the early part of the twenty-first century. Unlike the German case, the French case shows considerably lower values than the EU average in each of our three scenarios. This may indicate stronger resistance to further integration because even our optimistic scenario has trust levels well below 50 percent in 2021.
In sum, it is apparent that the level of trust in the EU fell significantly during and since the last financial crisis and recovered to its pre-crisis level in 2015. However, the overall trend is a steady decline since 2003. This raises another concern for EU integration, that of legitimacy. Several factors can be identified that result in low democratic citizen trust: problems of legitimacy, recession, mistrust, anti-EU propaganda of nationalist political parties, and negative attitudes towards migration. It is true that European integration has proceeded in a rather peculiar way, one characterized as an elite exercise, by those often detached from their respective constituencies in member states. As discussed in Chapter 3, developments on the ground make it clear that it cannot continue this way. In the early years, the political elites set the agenda. Big business elites joined them in the late 1970s and 1980s as these powerful individuals lobbied the Delors Commission to complete the Common Market. However, it was not until the Lisbon Treaty that citizens’ participation took the stage with the European Citizens Initiative (see Chapter 1). In addition, referendums in France and the Netherlands that failed to ratify the now defunct Constitutional Treaty clearly indicate that ignoring and/or not positively influencing public opinion is a great cost for present and future efforts to integrate.
We next analyze the relationship between integration and the three independent variables to test the following hypotheses:
- H1: Hierarchy is positively related with deepening of integration in the EU.
- H2: Convergence around regional leader’s values leads to deepening of regional integration.
- H3: Trust in the EU is a determinant of regional integration. Higher trust leads to more integration between member states.
Regression results
Our dependent variable, level of European integration (IAS), is bounded by the values of zero through five, with calculations producing fractions. The nature of integration, however, produces long periods of several years when there are no changes in the IAS’s value. The result is a stepwise plot where, for example, the EU would be a common market for many years before stepping up in its IAS score when it becomes an economic union. This is apparent in our historical overview of the EU’s evolution (see Chapter 1 and Figure 2.8 in Chapter 2). As a result, the variable takes on the characteristics of a categorical variable.
When the dependent variable is categorical, the ordinary least squares (OLS) method can no longer produce the best linear unbiased estimators; that is, OLS results will be biased and inefficient. Instead, the categorical dependent variable regression models (CDVMs) provide sensible ways of estimating parameters. Unlike the OLS, the CDVMs are not linear. This nonlinearity results in difficulty presenting the output of the CDVMs. In the CDVMs, the left-hand side (LHS) variable is neither interval nor ratio, but categorical. However, the right-hand side (RHS) could be linear function of independent variables as in the OLS. The CDVMs often depend on the maximum likelihood (ML) estimation method, whereas the OLS uses the moment-based estimation method.6
| Integration Achievement Score (IAS)a | Independent Variables | B | Std. Error | Wald | Sig. | Exp (B) | 95% Confidence Interval for Exp (B) |
| 1.16 (Free Trade Area) | Intercept | −21.77 | 11.57 | 3.54 | 0.060 | ||
| Value Convergence | 0.018 | 0.019 | 0.83 | 0.361 | 1.02 | 0.980–1.06 | |
| TNormal Trust | −0.311 | 0.178 | 3.06 | 0.080 | 0.733 | 0.517–1.04 | |
| Hierarchy | 1.147 | 0.431 | 7.07 | 0.008 | 3.15 | 1.35–7.33 | |
| 2.67 (Customs Union) | Intercept | −58.37 | 10.58 | 30.43 | 0.000 | ||
| Value Convergence | 0.005 | 0.010 | 0.202 | 0.653 | 1.01 | 0.99–1.03 | |
| TNormal Trust | 0.177 | 0.038 | 22.08 | 0.000 | 1.19 | 1.101–1.29 | |
| Hierarchy | 1.758 | 0.370 | 22.59 | 0.000 | 5.80 | 2.81–11.97 | |
| 3.17 (Common Market) | Intercept | −15.04 | 8.68 | 3.00 | 0.083 | ||
| Value Convergence | 0.015 | 0.007 | 4.90 | 0.027 | 1.02 | 1.00–1.03 | |
| TNormal Trust | 0.049 | 0.024 | 4.21 | 0.040 | 1.05 | 1.00–1.10 | |
| Hierarchy | 0.713 | 0.340 | 4.41 | 0.036 | 2.04 | 1.04–3.97 | |
| 3.50 (Economic Union) | Intercept | −27.19 | 8.97 | 9.18 | 0.002 | ||
| Value Convergence | 0.019 | 0.008 | 5.71 | 0.017 | 1.02 | 1.00–1.04 | |
| TNormal Trust | 0.105 | 0.031 | 11.40 | 0.001 | 1.11 | 1.05–1.18 | |
| Hierarchy | 0.983 | 0.345 | 8.11 | 0.004 | 2.67 | 1.36–5.26 | |
| 3.83 (EMU) | Intercept | −6.14 | 8.69 | 0.499 | 0.480 | ||
| Value Convergence | 0.033 | 0.007 | 21.03 | 0.000 | 1.03 | 1.01–1.05 | |
| TNormal Trust | 0.039 | 0.024 | 2.73 | 0.099 | 1.04 | 0.993–1.09 | |
| Hierarchy | 0.480 | 0.340 | 1.99 | 0.158 | 1.62 | 0.83–3.15 |
The IAS reference category is 0.00.
Classification of each IAS category (denoted by the IAS number) is an approximation of the corresponding level of regional integration.
The best choice would be to use the multinomial regression method. This method assumes categorical equivalency among the various stages of integration. The estimations, therefore, attempt to predict the likelihood of any one stage of integration given the levels of our observed independent variables. Below, we provide three different multinomial regression results for EU integration using the observed EU trust levels and our three sets of trust level projections (normal, low, and high). Both the observed and the projected values are the aggregations of European citizen beliefs in each member state.
Model 1 estimate – with trust projected at normal trend levels
Model 1 tests the relationship between integration (IAS dependent variable) and value convergence on Germany, trust towards the EU, and regional hierarchy. Table 4.1 presents the results of the multinomial regression. We estimated projections for each variable until 2021 using forecasts for GDP, hierarchy, and trust. For trust in the EU we estimated post-2016 data points based on the moving average of time series data from 1980–2016 for each member state. The model gives a Cox and Snell pseudo-R2 of 58.5 and Negelkere pseudo-R2 of 64.1 percent respectively and the Likelihood Ratio Tests are significant at 0.000 for all variables.
(4.4)
These results show that at the earlier stage of integration, the only variable that is significant is German leadership (hierarchy). This is consistent with the power transition argument that a leader (regional or global) must be present to promote cooperation between the participating states. Hierarchy continues to be a significant factor until the deepening of integration reaches the level of EMU. At that point (IAS = 3.83), which is deepest level of integration attained by some of the EU members thus far, hierarchy loses its effect on integration, indicating that it is now more important for the leader and other member states to project a collective effort to push for deeper integration (political union).
Convergence of values with Germany becomes significant around mid-level integration, the customs union, and continues to be an important factor for deepening of integration. This is an important result since it suggests the need for value convergence to the regional leader as integration deepens over time.
Finally, trust in the EU becomes crucial as soon as integration moves from the early stage of trade agreement into the customs union. However, given the current steady decline in citizens’ trust in the EU, the last stages of integration, EMU and beyond, do not show this variable being very significant (sig = 0.099). In other words, falling trust levels are not helpful for predicting the deepening of integration.
| Integration Achievement Score (IAS)a | Independent Variables | B | Std. Error | Wald | Sig. | Exp (B) | 95% Confidence Interval for Exp (B) |
| 1.16 (Free Trade Area) | Intercept | −24.73 | 14.03 | 3.10 | 0.078 | ||
| Value Convergence | 0.014 | 0.018 | 0.610 | 0.435 | 1.01 | 0.979–1.05 | |
| Low Trust | −0.312 | 0.168 | 3.44 | 0.064 | 0.732 | 0.527–1.02 | |
| Hierarchy | 1.20 | 0.513 | 5.47 | 0.019 | 3.32 | 1.22–9.08 | |
| 2.67 (Customs Union) | Intercept | −58.25 | 10.53 | 30.58 | 0.000 | ||
| Value Convergence | 0.005 | 0.010 | 0.229 | 0.632 | 1.01 | 0.985–1.03 | |
| Low Trust | 0.167 | 0.036 | 21.34 | 0.000 | 1.18 | 1.10–1.27 | |
| Hierarchy | 1.78 | 0.367 | 23.52 | 0.000 | 5.92 | 2.89–12.14 | |
| 3.17 (Common Market) | Intercept | −15.75 | 8.58 | 3.36 | 0.067 | ||
| Value Convergence | 0.015 | 0.007 | 4.82 | 0.028 | 1.02 | 1.00–1.03 | |
| Low Trust | 0.050 | 0.024 | 4.36 | 0.037 | 1.05 | 1.00–1.10 | |
| Hierarchy | 0.739 | 0.334 | 4.88 | 0.027 | 2.09 | 1.09–4.03 | |
| 3.50 (Economic Union) | Intercept | −27.35 | 8.85 | 9.54 | 0.002 | ||
| Value Convergence | 0.019 | 0.008 | 5.55 | 0.019 | 1.02 | 1.00–1.04 | |
| Low Trust | 0.101 | 0.030 | 11.38 | 0.001 | 1.11 | 1.04–1.17 | |
| Hierarchy | 0.999 | 0.340 | 8.65 | 0.003 | 2.77 | 1.40–5.29 | |
| 3.83 (EMU) | Intercept | −6.096 | 8.59 | 0.504 | 0.478 | ||
| Value Convergence | 0.032 | 0.007 | 20.85 | 0.000 | 1.03 | 1.02–1.05 | |
| Low Trust | 0.030 | 0.024 | 1.56 | 0.212 | 1.03 | 0.983–1.08 | |
| Hierarchy | 0.494 | 0.335 | 2.18 | 0.14 | 1.64 | 0.851–3.16 |
Reference point for IAS is 0.00.
Model 2 estimate – with trust projected at low level projection
In Model 2, we look at how IAS would be affected if trust towards EU among citizens continues to decline (Low Trust). The results can be found in Table 4.2.
(4.5)
Model 2 also has the Likelihood Ratio Tests significant at 0.000 for all variables and a Cox and Snell pseudo-R2 of 59 percent and Negelkere pseudo-R2 of 64.5 percent. The results are similar to findings in Model 1. Hierarchy is important in the early stages of integration and drops out at the EMU and beyond levels of integration. Convergence of values is a statistically significant factor in the mid-level of integration and continues to exert significant and positive effect on integration at higher levels of integration. On the other hand, if trust were to decline more than the current level seen (Model 1), it has no impact on integration. Without trust in the EU by their citizens, it would be terribly difficult for member states’ political leaders to push for the deepening of integration and attain the next stages of political union.
| Integration Achievement Score (IAS)a | Independent Variables | B | Std. Error | Wald | Sig. | Exp (B) | 95% Confidence Interval for Exp (B) |
| 1.16 (Free Trade Area) | Intercept | −21.54 | 10.94 | 3.88 | 0.049 | ||
| Value Convergence | 0.020 | 0.021 | 0.913 | 0.339 | 1.02 | 0.979–1.06 | |
| High Trust | −0.285 | 0.175 | 2.65 | 0.103 | 0.752 | 0.534–1.06 | |
| Hierarchy | 1.16 | 0.410 | 7.98 | 0.005 | 3.18 | 1.43–7.11 | |
| 2.67 (Customs Union) | Intercept | −58.11 | 10.73 | 29.32 | 0.000 | ||
| Value Convergence | 0.006 | 0.011 | 0.286 | 0.593 | 1.01 | 0.985–1.03 | |
| High Trust | 0.154 | 0.035 | 18.92 | 0.000 | 1.17 | 1.09–1.25 | |
| Hierarchy | 1.78 | 0.377 | 22.37 | 0.000 | 5.95 | 2.84–12.46 | |
| 3.17 (Common Market) | Intercept | −14.42 | 8.81 | 2.68 | 0.102 | ||
| Value Convergence | 0.016 | 0.007 | 4.97 | 0.026 | 1.02 | 1.00–1.03 | |
| High Trust | 0.048 | 0.024 | 4.08 | 0.044 | 1.05 | 1.00–1.10 | |
| Hierarchy | 0.691 | 0.346 | 3.99 | 0.046 | 2.00 | 1.01–3.93 | |
| 3.50 (Economic Union) | Intercept | −25.56 | 9.08 | 7.92 | 0.005 | ||
| Value Convergence | 0.020 | 0.008 | 5.90 | 0.015 | 1.02 | 1.00–1.04 | |
| High Trust | 0.080 | 0.029 | 7.45 | 0.006 | 1.08 | 1.02–1.15 | |
| Hierarchy | 0.967 | 0.352 | 7.55 | 0.006 | 2.63 | 1.31–5.24 | |
| 3.83 (EMU) | Intercept | −6.06 | 8.822 | 0.472 | 0.492 | ||
| Value Convergence | 0.033 | 0.007 | 21.24 | 0.000 | 1.03 | 1.02–1.05 | |
| High Trust | 0.048 | 0.024 | 4.17 | 0.041 | 1.05 | 1.00–1.10 | |
| Hierarchy | 0.461 | 0.347 | 1.77 | 0.183 | 1.59 | 0.804–3.13 |
Reference point for IAS is 0.00.
Model 3 estimate – with trust projected at higher levels
In Model 3, we reversed the projection in the previous model and estimated the improvement of member states’ trust levels by 5 percent per year until 2021. This should show how the IAS might be affected if decline in trust towards the EU is replaced by increased trust among citizens. Table 4.3 shows the results of the regression model.
(4.6)
Model 3 has a Likelihood Ratio Tests that are significant at 0.00 for the variables and Cox and Snell and Nagelkerke pseudo-R2 of 57.8 and 63.3 percent respectively. Under these conditions, our findings show that hierarchy is important in the early stages of integration and phases out towards the deeper stage of EMU and beyond – again consistent with the power transition argument. Value convergence shows its impact at IAS of 3.17, at the customs union stage, and continues to be an important factor at later levels of integration. Unlike models 1 and 2, trust in the EU is significant at the EMU stage. This indicates that an improved trust level is also very important for achieving EMU and political union.
Conclusion
The findings of these models are quite telling. For the EU to move beyond its current challenges and achieve stable and successful fiscal and political union, trust in the EU must improve among the citizens. Convergence of values among Europeans also shows that there are indeed emergent European values and that convergence on these values goes a long way in promoting the deepening of integration in the EU. Finally, hierarchy is important in the early stages of integration as a leader is essential in providing the guidance and public goods for pulling everyone together. However, as power asymmetry declines through either bringing in new members and/or improvements in the member states’ economies, hierarchy and the ability of the regional leader to provide resources for public goods stops being a significant factor for the deepening of integration. The regional leader is needed for the early institutional construction to establish the framework of future integration. As integration shifts to greater political cohesion, convergence of values and trust are more necessary for further development of common policies and the supranational quality of institutions.
With these results, we next turn our attention to examining how EU member states compare in their preferences on key policy challenges and what might be the potential outcome of their future negotiations over these issues. This is followed by an analysis of how the EU fares in competition with other giants on the world stage and an examination of what EU leaders need to do if they want to make their Union a stable, strong, and capable global power.
A Integration Achievement Score (coding system)
1 Trade in Goods and Services
- 0 = No agreements made to lower tariffs and non-tariff barriers
- 1 = Preferential Tariff Agreement
- 2 = Partial Free Trade Area
- 3 = Full Free Trade Area
- 4 = Customs Union (Common External Tariffs)
- 5 = No barriers between member countries
2 Degree of Capital Mobility
- 0 = No agreements made to promote capital mobility
- 1 = Foreign Direct Investment allowed in limited form
- 2 = Capital withdrawal allowed
- 3 = Full access for foreign investment and capital withdrawal, except for national government procurement
- 4 = Full capital mobility expect for large-scale mergers and acquisitions
- 5 = Full capital mobility without restriction
3 Degree of Labor Mobility
- 0 = No agreements made to promote labor mobility
- 1 = Right of movement granted for select professions
- 2 = Full right of movement
- 3 = Transferability of professional qualifications granted
- 4 = Transferability of pensions and other retirement devices
- 5 = Full freedom of movement
4 Level of Supranational Institution Importance
- 0 = No supranational institutions
- 1 = Establishment of nominal institutions
- 2 = Information gathering and advisory role
- 3 = Ability for institutions to amend proposals
- 4 = Ability for institutions to veto proposals
- 5 = Supranational institutions operate as primary decision node
5 Degree of Monetary Policy Coordination
- 0 = No monetary policy coordination
- 1 = Consultation regarding policy
- 2 = Commitment to maintain parity
- 3 = Coordinated interventions
- 4 = Regional Central Bank establishment
- 5 = Single currency
6 Degree of Fiscal Policy Coordination
- 0 = No fiscal policy coordination
- 1 = Consultation regarding policy
- 2 = Commitments regarding deficit spending and taxation
- 3 = Sanctions regarding breaking commitments
- 4 = Uniform tax code
- 5 = Single budget
- Each category has a value of 0 (low) through 5 (high) along a Guttman scale:
B Hierarchy
Hierarchy is one of the independent variables used in the multinomial regression model. This variable measures the difference between the relative power of a regional leader and of other states in the EU. We take Germany as the regional leader of the European system. Consequently, Hierarchy variable points out the relative power difference between Germany and the rest of the member states of the EU. We take the GDP (in purchasing power parity) of states and calculate hierarchy in the following way:
Data for Hierarchy comes from the International Monetary Fund, World Economic Outlook Database (April 2016). The higher the Hierarchy, the higher the capability of the regional leader over the other states in the region. If Hierarchy declines, it is an indication that the power gap between the regional leader and other countries is decreasing.
C Value Convergence
The distance of values between two countries is called ”value convergence.” This variable is calculated by measuring the Euclidean distance between the points on the values vectors, which can be seen on the values map. The X-axis represents the Traditional–Secular Values, and the Y-axis displays the Materialist–Postmaterialist Values on the map. Value Convergence (value distance) of Country a and Country b is calculated as follows:
The statistical model that is utilized in the analyses focuses on value convergence towards Germany. This variable centers on the value distances of all the EU countries towards Germany. This value convergence indicator is abbreviated as “VcGer.” Value Convergence towards Germany (VcGer) is calculated as follows:
Value Convergence data is multiplied by −1 after being calculated. Since this variable is about distances between value points, when countries are closer to each other in terms of values, the level of cooperation or integration is expected to increase. Therefore, the value distance between countries and the level of integration have an inverse relationship. This inverse relationship would create a negative coefficient for Value Convergence in statistical tables and can be confusing for the audience when interpreting the results. As a result, Value Convergence calculations are multiplied by −1; the meaning of the conception is preserved: the higher the level of value convergence between countries, the higher the level of cooperation/integration. Multiplying the calculation results of Value Convergence has no effect on the weight of the variable. Therefore, this procedure does not affect the coefficients of the statistical results. It only changes the sign of VcGer to (+) from (−).
D Trust Estimation
There are three estimation variables for Trust after 2016. These are trust_normal, trust_low, and trust_high. Trust_normal is calculated via Excel’s Trend function. The Trend function is adjusted to take into account the previous four years of data for every estimated year. The other two estimations are based on trust_normal; trust_low and trust_high are calculated in Excel as follows:
trust_low
trust_high
2014
.
.
2015
.
.
2016
.
.
2017
= trust_normal × 0.95
= trust_normal × 1.05
2018
= trust_normal × 0.90
= trust_normal × 1.10
2019
= trust_normal × 0.85
= trust_normal × 1.15
2020
= trust_normal × 0.80
= trust_normal × 1.20
2021
= trust_normal × 0.75
= trust_normal × 1.25
Trust_low and trust_high calculations are designed to create an opening fork around the normal estimation to capture any fluctuation in future Trust.
Notes
1Solemn Declaration on European Union European Council, Stuttgart June 19, 1983, in Bulletin of the European Communities, no. 6 (1983): 24–29.
2William Riker, “Federalism” in Handbook of Political Science, vol. V, ed. by Fred Greenstein and Nelson Polsby (Reading, MA.: Addison-Wesley, 1975): 93–172; Daron Acemoglu and James Robinson, Why Nations Fail: The Origins of Power, Prosperity, and Poverty (New York: Crown Publishers, 2012).
3The Integration Achievement Score was first developed in Gary C. Hufbauer and Jeffery J. Schott, Western Hemisphere Economic Integration (Washington, DC: Institute for International Economics, 1994), and then later expanded and further developed in Brain Efird and Gaspare M. Genna, “Structural Conditions and the Propensity for Regional Integration” European Union Politics 3, no. 3 (2002): 267–295.
4See Matthew Gabel, Interests and Integration: Market Liberalization, Public Opinion, and European Union (Ann Arbor, MI.: University of Michigan Press, 1998).
5Gaspare M. Genna “Positive Country Images, Trust, and Public Support for European Integration” Comparative European Politics 7, no. 2 (2009): 213–232; Gaspare M. Genna, “Images of Europeans: Transnational Trust and Support for European Integration” Journal of International Relations and Development 20, 2 (2017): 358–380.
6Hun Myoung Park, Categorical Dependent Variable Regression Models Using STATA, SAS, and SPSS University Information Technology Services Center for Statistical and Mathematical Computing (www.indiana.edu/∼statmath).